
Shoreline Change Assessment for Kerala Coast
With a coastline of over 600.15 Km, coastal erosion is considered as one of the significant threatening hazards faced by the coastal population of Kerala. The National Centre for Coastal Research (NCCR) has carried out a study on shoreline changes along the mainland of the Indian Coast. About 600 km long shoreline distributed among nine coastal districts and one UT was analyzed by NCCR for the period from 1990-2018 to estimate shoreline changes. The shoreline analysis suggests that 46% of coast is eroding, 23% is accreting and 31% is in stable state. The details are given in Table 1.
Table 1. Erosion and Accretion Percentage along Kerala Coast (1990–2018)
| 1990-2018 | Status | (7 Class) % | Length (in km) | (3Class) % | Length (in km) |
| Kerala | High Erosion | 1 | 5.53 | 46 | 275.33 |
| Moderate Erosion | 2 | 9.26 | |||
| Low Erosion | 44 | 260.53 | |||
| Stable | 31 | 182.64 | 31 | 182.64 | |
| Low Accretion | 17 | 100.69 | 23 | 134.99 | |
| Moderate Accretion | 3 | 17.84 | |||
| High Accretion | 3 | 16.45 |
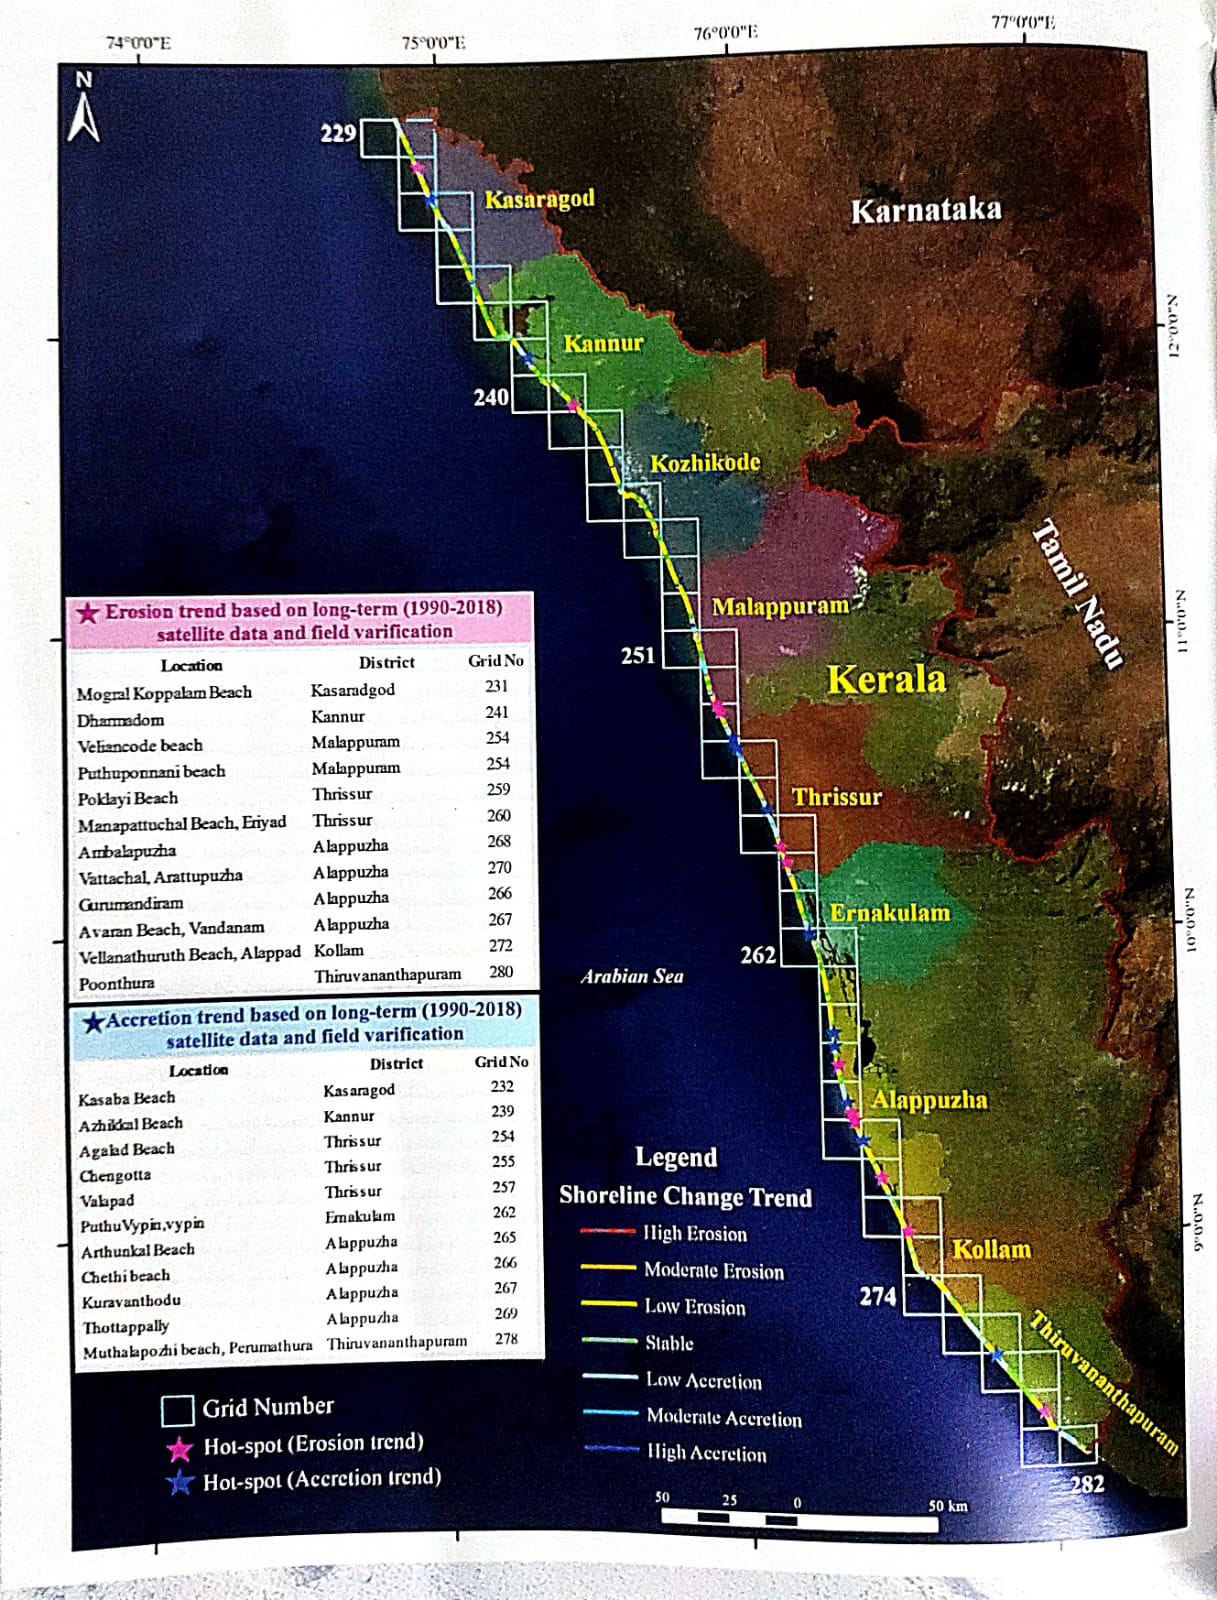
The district wise analysis suggests that the Kozhikkode (67.7%) and Alappuzha (54.1%) coasts, erosion exceeds more than 50%, followed by Kollam (49.7%), Malappuram (49.2%) and Thrissur (49.1%) is the only coastal state, which is having more than 40% of accretion, followed by Thiruvananthapuram with 31.2%. Most of the coastal districts of Kerala shows eroding trend for the past 28 years shoreline change analysis. The district wise details of shoreline changes status are given below in Table 2.
Table 2. District wise shoreline changes (in percentage)
| Districts | Coastal Length | Erosion | Stable | Accretion |
| In % | ||||
| Kasargode | 83.51 | 38.8 | 42.6 | 18.5 |
| Kannur | 69.05 | 46.4 | 31.8 | 21.8 |
| Kozhikkode | 78.05 | 67.7 | 25.5 | 6.7 |
| Malappuram | 50.86 | 79.2 | 32.6 | 18.2 |
| Thrissur | 61.55 | 31.8 | 19.1 | 49.1 |
| Ernakulam | 45.05 | 43.2 | 38.30 | 18.50 |
| Alappuzha | 83.55 | 54.1 | 22.70 | 23.20 |
| Kollam | 45.72 | 49.7 | 31.90 | 18.40 |
| Thiruvananthapuram | 75.62 | 34.4 | 34.4 | 31.20 |
| Total | 592.96 | 46.4 | 30.80 | 22.80 |
Table 3. shows the seven different classes of erosion, accretion and stable in kilometers for all nine coastal districts of Kerala
Table.3. District wise shoreline status of Kerala
|
Length in km (1990-2018) |
||||||||
|
Districts |
Length (in kms) |
High Erosion |
Moderate Erosion |
Low Erosion |
Stable |
Low Accretion |
Moderate Accretion |
High Accretion |
|
Kasargode |
83.51 |
0.02 |
0.14 |
32.26 |
35.60 |
13.25 |
0.46 |
1.78 |
|
Kannur |
69.05 |
0.05 |
0.18 |
31.82 |
21.97 |
11.72 |
2.84 |
0.46 |
|
Kozhikkode |
78.05 |
0.76 |
0.57 |
51.53 |
19.93 |
4.67 |
0.34 |
0.25 |
|
Malappuram |
50.86 |
0.12 |
1.28 |
23.60 |
16.58 |
8.93 |
0.20 |
0.14 |
|
Thrissur |
61.55 |
0.00 |
0.41 |
19.18 |
11.76 |
18.23 |
7.92 |
4.04 |
|
Ernakulam |
45.05 |
0.02 |
0.26 |
19.19 |
17.26 |
4.93 |
0.50 |
2.89 |
|
Alappuzha |
83.55 |
2.03 |
5.29 |
37.85 |
18.99 |
11.79 |
3.26 |
4.35 |
|
Kollam |
45.72 |
1.91 |
0.28 |
20.55 |
14.57 |
7.25 |
0.31 |
0.85 |
|
Thiruvananthapuram |
75.62 |
0.62 |
0.85 |
24.55 |
25.98 |
19.92 |
2.01 |
1.69 |
|
Total |
592.96 |
5.53 |
9.26 |
260.53 |
182.64 |
100.69 |
17.84 |
16.45 |
|
275.33 |
182.64 |
134.99 |
||||||